Introduction
As engineers, we put a lot of effort into building highly scalable applications. We spend time on up-front design, code reviews, and testing. As soon as the application is deployed and ends up in the hands of the customer, we are unfortunately going to see unexpected usage patterns, issues, and errors.
Monitoring becomes critical to provide a quick and accurate way of identifying problems and finding the root cause. Proper metrics help us proactively detect and fix issues before they blow up. On the other hand, a lack of metrics means that we don’t notice problems quickly enough and react to issues only after the customers contact us. This will eventually lead to customer dissatisfaction as they cannot use our services.
This article provides a strategy and hands-on tips for monitoring an IO-bound microservice with minimal effort while trying to get as much visibility as possible. The ideas here don’t work very well if we have a CPU-bound microservice, for example, if our service is responsible for calculating the new digits of π.
We’re going to look purely into which metrics to collect. We’re not going to discuss neither how to collect the metrics nor how to alert on the metrics. Both of the subjects require a separate discussion and analysis.
To gain the most out of the article, we should have a basic understanding of microservices integration patterns (including Kafka) and prior exposure to Prometheus or any similar system.
Categorization of Monitors
We can roughly divide monitoring into three distinct categories:
- infrastructure-level - concerned about metrics such as CPU, RAM, and disk usage, etc.
- application-level - concerned about metrics internal to a microservice. For example, the number of incoming requests, response latency, etc.
- business-level - metrics driven by the business. For example, how often a specific feature has been used over the past week, how long customers spend on a specific page, etc.
Both infra- and application-level metrics are usually monitored with StatsD and DataDog or Prometheus and Grafana. However, business-level metrics are usually tracked using Amplitude, for example.
As the title of the article states, we’re going to focus only on the application-level monitoring. While proper infrastructure- and business-level monitoring is vital, both of them require applying a different set of principles.
The Strategy
What are the metrics of a microservice we want to monitor? Theoretically, we can instrument every line of code. Unfortunately, this unmanageable approach would produce a massive observability tooling bill with little value. We need to find a better strategy where the amount of monitors gives us the best overview of the system’s health.
The Four Golden Signals, published by Google, offers a great way to implement good application-level monitoring where we balance efficiently the number of monitored components and the visibility.
The Four Golden Signals are:
- Latency - shows us how long it takes to respond to a request.
- Traffic - indicates how many requests a service has to serve.
- Errors - the rate of failing requests.
- Saturation - how much traffic the system serves compared to its peak capacity. A fully saturated service is a service that cannot accept any more requests.
The strategy applied in a real-life scenario involves two steps:
- detecting all the inputs and outputs of a service
- applying the Four Golden Signals across all the inputs and outputs.
In an IO-bound system, where the service is mostly concerned with accepting requests, mapping them, and sending a request to a subsystem, the strategy offers a great view of the system’s behavior. Any significant change in the metrics is likely to indicate visible customer impact.
While these signals indicate symptoms, the root cause may be completely elsewhere. For example, an increased rate of 5xx responses can have multiple causes: downstream connections timing out or a bug in the software, for example.
Sample Application
To make the rest of the article practical, let’s first take an example application to illustrate the strategy.
The company we’re working for provides a service to different karaoke bars worldwide. Our customers can use the application to provide an easy way for bar visitors to queue up. When it’s the turn of a visitor, we automatically show the lyrics on all the TVs in the karaoke bar.
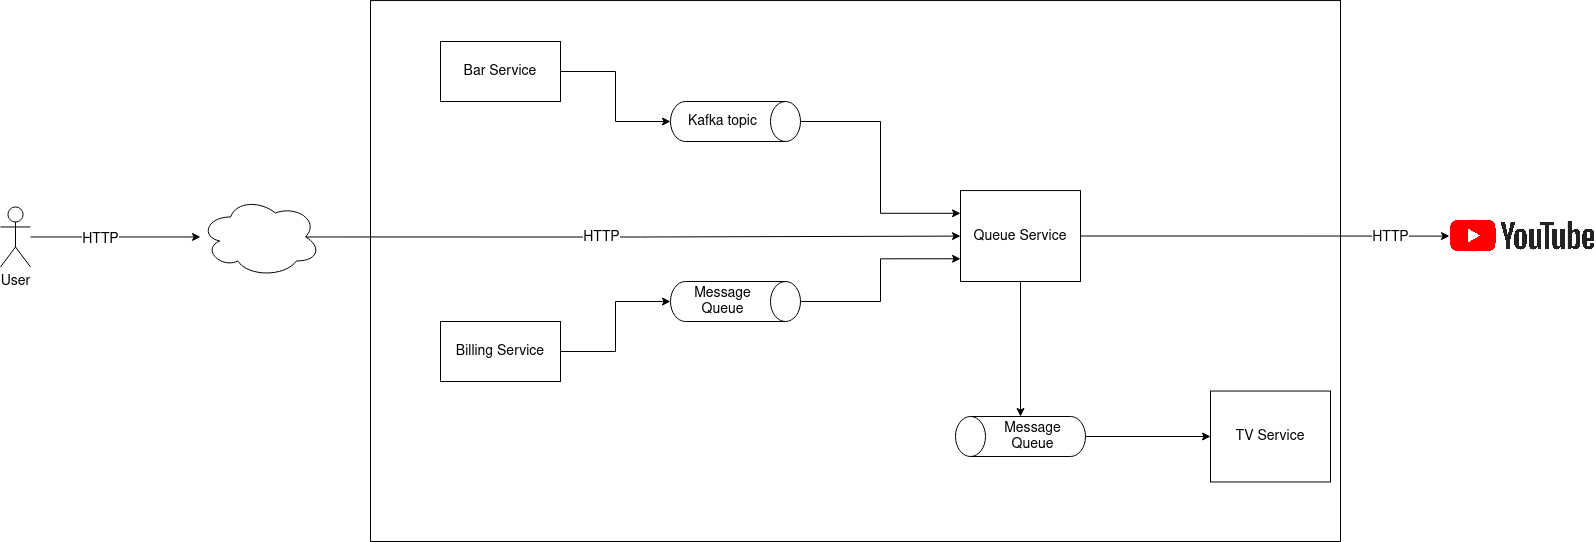
Figure 1.1. Sample application
Our team is responsible for Queue Service which deals with the singer queue management. The service has 3 different inputs:
- HTTP calls from the visitors of a karaoke bar
- A Kafka topic from Bar Service. Bar Service emits an event every time the state of a karaoke bar changes. For example, if a karaoke bar just opened their doors.
- Message queue from Billing Service. Billing Service adds a job to the queue every time a karaoke bar has exceeded its monthly allowance. Our goal is to process the message and ensure that upon exceeding the billing limit, the visitors can’t queue up anymore.
As we can see, Queue Service has two outputs:
- HTTP calls to YouTube to list for listing the songs
- Message queue to TV Service whenever we need to switch the song on the TVs.
Disregard that we may replace a message queue with an event streaming platform such as Kafka or vice-versa. The article’s main point outlines the most common service-to-service communication technologies and how to apply the signals to different communication technologies.
Input Monitoring
Once we have figured out all the inputs and outputs of a service, the next step is to see how we can instrument them.
HTTP
Per the Four Golden Signals, we should measure incoming HTTP calls’ latency, traffic, errors, and saturation. That way we understand if the users can successfully queue themselves up on a busy Friday night.
| Signal | Metric | Unit |
|---|---|---|
| Latency | Request processing time | seconds |
| Traffic | The number of incoming HTTP calls | count |
| Errors | The number of failed HTTP calls (for example, 5xx status code) | count |
| Saturation | Thread pool usage | count or seconds |
The exact details of the thread pool usage metric depend on the programming language and the concurrency strategy of the application. For example, in the case of a multithreaded environment, such as Ruby, we can allocate a specific number of threads that can process the requests. Monitoring the number of threads in use provides a valuable indication if our application can accept more requests.
However, Node.js handles concurrency via an event loop. Hence, there’s no such thing as a thread pool. In such cases, monitoring the event loop lag is a good indication of saturation. If the event loop lag spikes significantly, then we know that our system is under an increased load and has a hard time serving the new incoming requests.
Queue
As our company wants to make money, we must ensure that if a karaoke bar exceeds its allocated usage limits, we no longer allow visitors to sign up.
The signal for an exceeded billing limit is a job in the message queue. We need to monitor the message queue from the perspective of the consumer. Considering the Four Golden Signals, how can achieve that?
| Signal | Metric | Unit |
|---|---|---|
| Latency | Message processing time | seconds |
| Traffic | The number of consumed jobs | count |
| Errors | The number of failed jobs | count |
| Saturation | Queue length | count |
However, that’s not enough.
Every resilient system should also have a dead-letter queue. All the jobs that we’re unable to process should end up there. Monitoring the same aspects of the dead-letter queue offers another critical insight into the workings of the service.
Kafka
Following the same pattern, we have a third type of input to our system: a Kafka topic.
It’s impossible to measure the lenth of a Kafka topic due to its nature. However, Kafka has a very similar metric - consumer group lag. The consumer group lag indicates in terms of offsets how far behind a specific consumer group is from the latest message of a topic.
Keeping an eye on the consumer group lag is necessary for every application relying on Kafka. The metric exposes potential issues in the message processing pipeline. Unfortunately, the lag isn’t monitored often and the metric is discovered only after the first issues with the pipeline.
| Signal | Metric | Unit |
|---|---|---|
| Latency | Event processing time | seconds |
| Traffic | The number of consumed events | count |
| Errors | The number of failed events | count |
| Saturation | Consumer group lag | offset count |
Output Monitoring
Not monitoring any of the outputs leads to a direct customer impact - for example, if we cannot list any songs from YouTube. Hence, monitoring the outputs is critical for ensuring the well-being of our application.
While the four golden signals fit perfectly for the inputs of the system, the method requires a bit of tweaking when we want to instrument the outputs.
Queue Service has two outputs: a message queue consumed by the TV service and HTTP calls to YouTube. Let’s tackle those one by one.
Queue
| Signal | Metric | Unit |
|---|---|---|
| Latency | The amount of time it takes to produce a message | seconds |
| Traffic | The number of produced messages | count |
| Errors | The number of messages we failed to produce | count |
| Saturation | Queue size | count |
We may think we can derive the number of messages we fail to produce if we see traffic from the consumer side. That’s true, but this logic doesn’t work always. Imagine a case where the traffic increased by 10% for a legitimate reason. At the same time, we failed to produce the extra 10% of the messages. We reach to a situation where the number of messages the consumer sees stays the same as in the past. However, our application is not working correctly and we’re losing 10% of the data.
In addition to the four metrics, we also should instrument the payload size. Keeping an eye on the metric allows us to keep the required storage under control. For instance, Redis is a popular backing store for a message queue. As an in-memory datastore, it has a very limited storage space. If we suddenly produce messages at the old rate, but the payload of the message increases 10 times, we may see Redis crashing and taking down our application.
HTTP
Last but not least, according to the proposed strategy we also want to monitor the outgoing HTTP calls. Outgoing HTTP calls are part of the critical user journey, so any delays or issues will immediately indicate customer impact.
| Signal | Metric | Unit |
|---|---|---|
| Latency | Response latency | seconds |
| Traffic | The number of outgoing HTTP calls | count |
| Errors | The number of failed outgoing HTTP calls | count |
| Saturation | Outgoing HTTP thread pool usage | count |
These metrics help to signal potential customer-facing issues. Besides, suppose we detect that some API paths are very slow or return an unreasonable amount of 5xx responses. What would be nicer than letting fellow engineers know about potential problems with their HTTP interface?
Conclusion
The article introduced the Four Golden Signals and explained how to convert the principles into practice.
The key to effective monitoring is discipline - inspecting every input and output of a service and applying the signals to every one of them. The startegy gives a very good overview of most of the potential issues our customers experience.